In a dark room, press a flashlight against your fingertip. Your finger glows red. Some of the light makes it through skin, bone and blood and comes out the other side. The pulse oximeter clipped onto patients’ fingers in hospitals relies on this simple observation: it measures oxygen in the blood by looking at the light that passes through.

How Does fNIRS Do It?
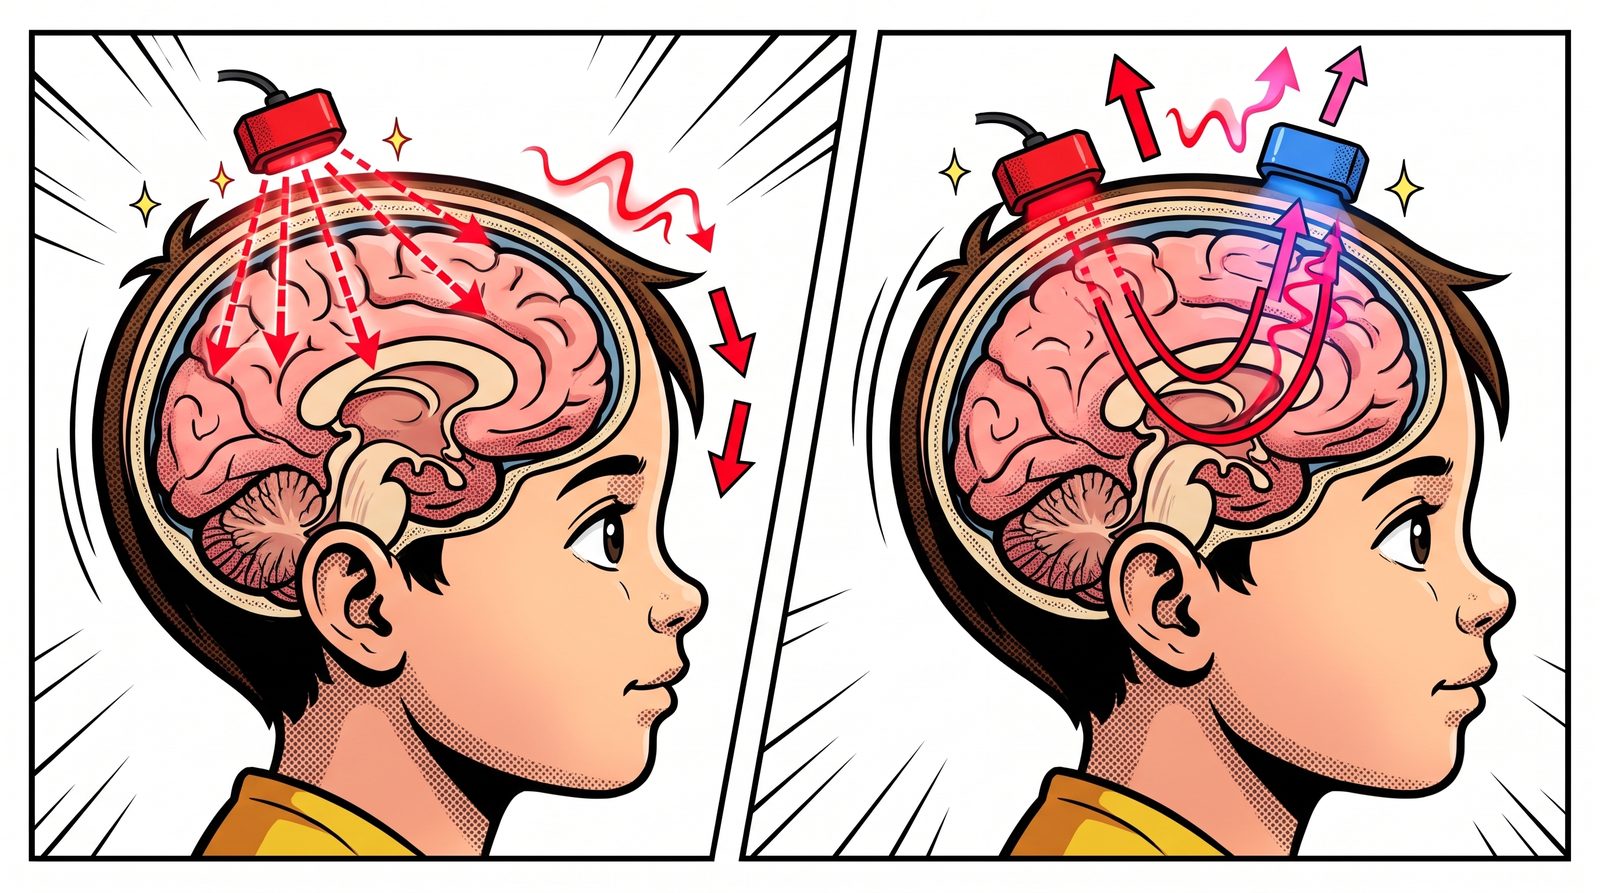
fNIRS (functional near-infrared spectroscopy) applies the same idea to the head. We place small light sources on the scalp, with light detectors a few centimetres away. Light from the source scatters through the tissue, some of it reaches the surface of the brain, turns back and arrives at the detector. By looking at how much of the light was lost on the way, we learn what is happening in the blood of that region.
Why Near-infrared?
Most visible light is absorbed as soon as it enters tissue. But for near-infrared light, roughly 700–1000 nanometres, biological tissue is surprisingly “transparent”. Frans Jöbsis noticed this “optical window” in 1977 and showed that light could cross the skull and reveal oxygen changes in the brain.
What makes this window useful is haemoglobin. Oxygen-carrying haemoglobin (HbO) and haemoglobin that has released its oxygen (HbR) absorb light differently at different wavelengths. By measuring at two wavelengths, we can work out the change in each of them separately.
A Working Region Asks For Blood
The brain has no real energy storage. When a region gets busy, fresh oxygenated blood is rushed there. This is called neurovascular coupling. Think of a city council adding extra buses to a neighbourhood at rush hour: when the crowd grows, the service grows too, often a bit more than needed.
As a result, oxygenated haemoglobin rises and deoxygenated haemoglobin falls in the active region. fNIRS picks up this opposite movement. So fNIRS doesn’t listen to neurons directly; it tracks the blood the neurons “ordered”.
A Banana-shaped Path
Light doesn’t travel from source to detector in a straight line. It scatters through the tissue along a curved, banana-shaped path. The farther apart the source and detector, the deeper the banana goes, but the less light comes back. In practice, a distance of about 3 centimetres in adults reaches the outer surface of the brain, the top few millimetres of the cortex. Deeper structures are out of fNIRS’s reach.
What Does The Output Look Like?
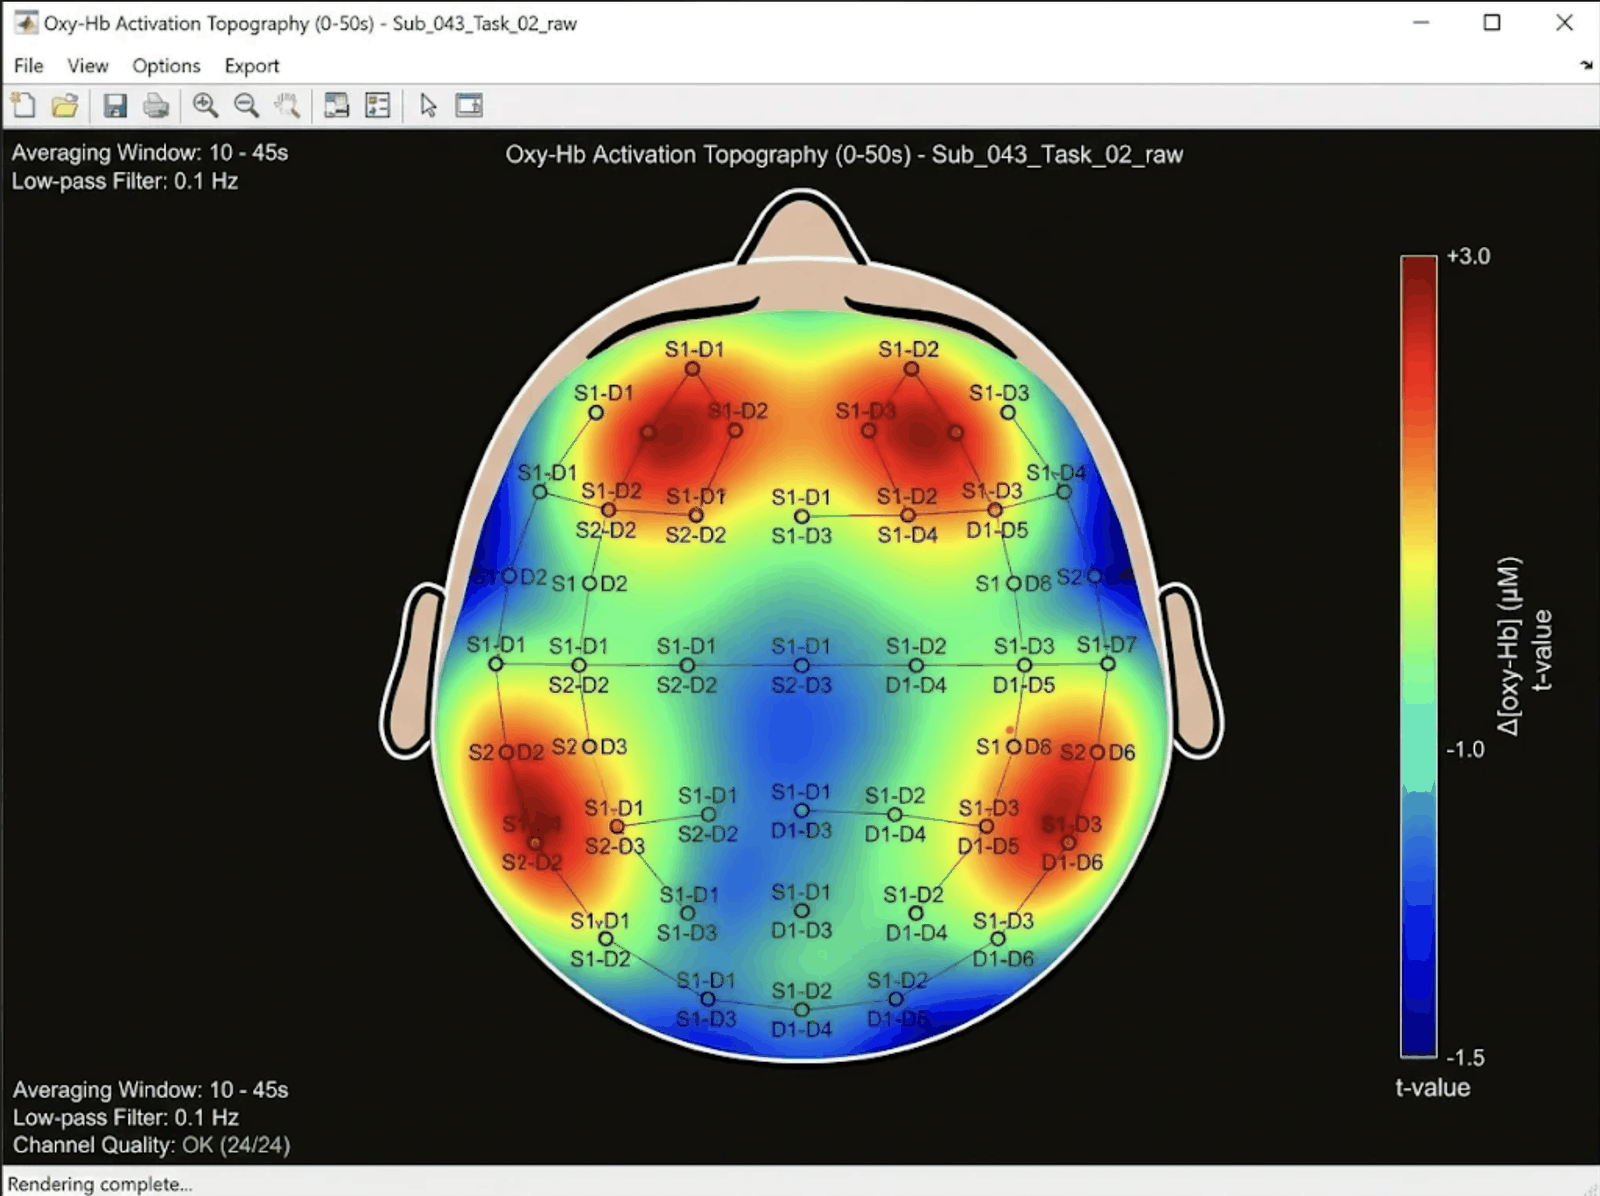
Each source–detector pair forms a channel. Labels like S1-D1 in the figure show which source is paired with which detector. Each channel gives us two curves over time: the change in oxygenated and in deoxygenated haemoglobin.
If we average these curves over a time window during the task and compare them with rest, we get a colour map over the head. Red areas are where oxygenated haemoglobin rose clearly during the task, the regions “ordering” more blood. Blue areas show no rise, or a drop.
Compared With EEG
EEG listens to the roar from the stadium: it catches electrical activity within milliseconds but struggles to say exactly where the sound comes from. fNIRS watches the bus traffic heading to the stadium: changes in blood flow take a few seconds to show up, but which area is getting “crowded” is clearer.
That’s why the two are complementary, not rivals. Many studies use EEG and fNIRS together in the same cap: one answers “when” better, the other “where”.
Strengths And Weaknesses
Pros:
- Portable and silent. Nobody has to lie inside a tube; recordings can be made at a desk, while walking or while shopping.
- More tolerant of movement than fMRI, and much cheaper.
- Easy to use with babies and children.
Cons:
- It only sees the surface of the brain.
- Light passes through the scalp first, so blood flow in the skin leaks into the signal. Extra short-distance channels and signal processing are used to remove it.
- Dark, thick hair can block the light, and placing the optodes takes patience.
fNIRS In The Lab
The first functional fNIRS measurements in the human brain were made in 1992. Since then the field has moved from single-channel devices to wireless systems that cover the whole head. In our lab we are working on an improved whole-head fNIRS system that can run artificial intelligence on the device itself. For the latest on this work, see our TÜSEB news.
References
- Jöbsis, F. F. (1977). Noninvasive, infrared monitoring of cerebral and myocardial oxygen sufficiency and circulatory parameters. Science, 198(4323), 1264–1267. doi:10.1126/science.929199
- Ferrari, M., Quaresima, V. (2012). A brief review on the history of human functional near-infrared spectroscopy (fNIRS) development and fields of application. NeuroImage, 63(2), 921–935. doi:10.1016/j.neuroimage.2012.03.049